


Founder-Led GTM Dashboard: What to Track Weekly
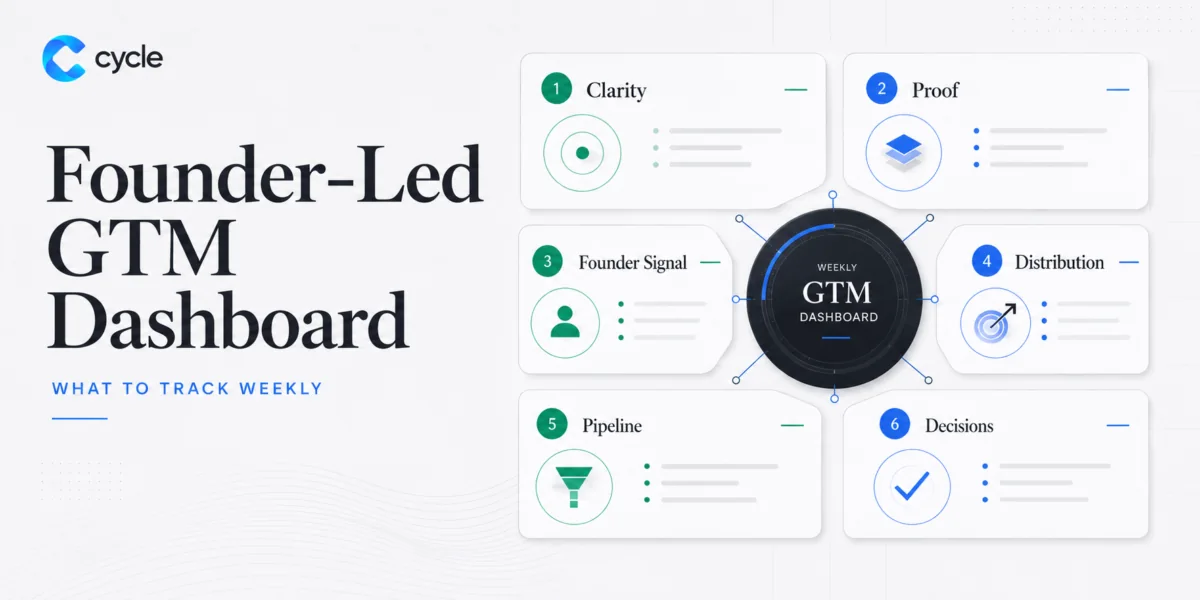
Short answer: a founder-led GTM dashboard should track whether the company is becoming easier to understand, trust, introduce, discuss, and buy from. Weekly GTM tracking should include market clarity, proof layer strength, founder signal, public surface movement, channel execution, pipeline signal, objections, and decisions. It should not be a vanity dashboard full of impressions that nobody uses to change the GTM system.
Most startup marketing dashboards are too channel-specific too early. They show traffic, impressions, followers, clicks, email opens, paid spend, engagement, leads, or content output. Those metrics can matter. But for founder-led technical companies, they often miss the more important question: is the market becoming more convinced?
A founder-led GTM dashboard should not only report what happened. It should help the founder and operator decide what to clarify, prove, publish, route, brief, or stop doing next week.
That is the difference between reporting and operating.
Why founder-led GTM needs a different dashboard
Traditional marketing dashboards assume the company already has clear positioning, a trusted proof layer, a defined buyer journey, and channels that can be optimized independently.
Founder-led technical companies often do not start there. They may have a strong product but unclear market category, founder credibility that is not visible publicly, proof assets scattered across decks and calls, content that educates but does not create demand, or multiple vendors reporting their own numbers.
In that context, a dashboard that only tracks impressions can make the company look active while the GTM system remains unclear.
A better dashboard tracks signal across the whole GTM operating layer.
The six layers to track weekly
| Layer | Weekly question | Example signals |
|---|---|---|
| Clarity | Is the market understanding the company faster? | repeated questions, page engagement, sales-call explanation time |
| Proof | Is the company more believable this week? | new proof assets, case studies, product evidence, partner signals |
| Founder signal | Is the founder becoming a trust source? | founder posts, replies, intros, conversations, media quotes |
| Distribution | Are channels sending attention to the right proof? | PR, content, community, paid, partner, SEO movement |
| Pipeline signal | Is attention turning into useful next steps? | demos, calls, intros, qualified DMs, investor or partner interest |
| Decisions | What changed because of the data? | copy updates, proof gaps, channel shifts, vendor briefs, next actions |
The last layer is the most important. If nothing changes, the dashboard is a museum.
Layer 1: market clarity
Market clarity is the first metric because unclear companies waste attention.
Track whether people understand the category, audience, problem, timing, proof, and next step. Useful signals include repeated questions in sales calls, confusion in replies or DMs, high homepage traffic with low next-step action, people describing the company incorrectly, and partners using the wrong angle.
A simple weekly score can work:
- Market still confused.
- Some surfaces clearer, but objections repeat.
- Core claim understood by warm audiences.
- Partners and prospects can repeat the story.
- The market understands the category, proof, and next step quickly.
This is not scientific. It is operational.
Layer 2: proof layer strength
Proof layer strength tracks whether the company has made its claims more believable.
Each week, ask what new proof asset was created, which claim is still unsupported, which proof is visible publicly, and which proof is trapped in private calls or decks.
Proof can be customer evidence, usage data, case study, founder track record, product demo, partner quote, technical benchmark, community behavior, media reference, investor-facing traction, or public roadmap delivery.
CYCLE treats this as infrastructure. A proof layer audit for founder-led startups is useful because every channel depends on what the market can verify after attention arrives.
Layer 3: founder signal
Founder-led GTM needs the founder’s judgment to become visible.
Track whether the founder is creating market signal, not just posting for activity. Did the founder publish a clear POV? Did that POV connect to the company’s market claim? Did it create replies, intros, sales conversations, investor interest, or partner discussion? Did it reveal objections or language the market uses?
Founder signal is not only social media performance. It can show up in calls, public comments, interviews, community answers, investor updates, and partner conversations.
Layer 4: distribution movement
Distribution still matters. Track channels, but in relation to the proof system: SEO impressions and indexed pages, PR outreach and coverage, partner amplification, community engagement, paid traffic quality, creator activity, email performance, founder content performance, internal links, and traffic to proof assets.
The key question is not which channel got the most numbers. The key question is: did the channel move the right audience toward the right proof?
This is why founder-led demand generation should be measured by more than traffic volume.
Layer 5: pipeline signal
Pipeline signal means the market is doing something useful after exposure.
Useful signal may include qualified demo requests, founder DMs from relevant people, investor follow-ups, partner intros, community members asking high-intent questions, prospects referencing a specific proof asset, media requests, or fewer basic explanation loops in sales calls.
Pipeline signal is not always a closed deal. It is evidence that GTM is creating higher-quality market movement.
Layer 6: decisions
A dashboard becomes useful when it forces decisions.
Every weekly review should end with:
- What became clearer?
- What proof is still missing?
- Which claim is underperforming?
- Which channel should be amplified?
- Which channel should pause?
- Which page, deck, post, brief, or FAQ should change?
- What is the single most important GTM action next week?
This is where the GTM Control Room matters. The control room turns metrics into operating decisions around founder signal, proof, narrative, vendors, and execution.
A simple weekly dashboard template
| Metric area | Track weekly | Decision it should inform |
|---|---|---|
| Market clarity | Top repeated questions and objections | Update homepage, FAQ, deck, founder content |
| Proof layer | New proof assets and missing proof | Build case, demo, proof page, customer story |
| Founder signal | Founder posts, replies, conversations | Double down on POV, refine narrative, route interest |
| Public surface | Website pages, SEO pages, case studies | Improve pages that receive attention but do not convert |
| Distribution | Channel activity and traffic quality | Shift effort toward channels that move qualified audiences |
| Pipeline | Demos, DMs, intros, partner interest | Prioritize follow-up paths and sales enablement |
| Vendor execution | Outputs shipped, blockers, brief quality | Rewrite briefs, pause weak work, clarify ownership |
| Next decision | One weekly priority | Keep GTM from becoming random activity |
This template is intentionally not overloaded. The goal is not to prove that marketing is busy. The goal is to make better GTM decisions.
What not to track as the main dashboard
Do not make these the primary weekly dashboard: total impressions without audience quality, follower count without trust movement, content volume without message consistency, PR mentions without proof or conversion path, paid clicks without public-surface readiness, community activity without answer quality, vendor output without strategic contribution, or rankings without internal-link and conversion context.
These can be supporting metrics. They should not replace the operating view.
How CYCLE uses GTM dashboards
CYCLE uses dashboards as operating tools, not reporting theater.
The dashboard should connect weekly execution to the founder-led GTM system: what the market is understanding, what proof is visible, what founder signal is working, what channels are useful, what vendors need clearer briefs, what pages should change, and what the next GTM decision is.
This connects directly to the GTM Readiness Scorecard: a company should know whether it is ready for more distribution before it measures distribution as if the system is already mature.
FAQ
What is a founder-led GTM dashboard?
A founder-led GTM dashboard is a weekly operating view that tracks market clarity, proof, founder signal, distribution, pipeline signal, and GTM decisions for a founder-led company.
How is it different from a marketing dashboard?
A marketing dashboard often reports channel performance. A founder-led GTM dashboard connects channel performance to proof, messaging, founder signal, and weekly operating decisions.
What should be tracked weekly?
Track repeated objections, proof assets, founder content, public-surface movement, channel quality, pipeline signal, vendor execution, and the decisions made from those signals.
Should early startups track revenue in the dashboard?
Yes, when revenue signal exists. But before there is enough volume, the dashboard should also track leading indicators: qualified conversations, intros, objections, proof inspection, and market clarity.
How does CYCLE help?
CYCLE helps founder-led companies build the GTM operating cadence around the dashboard: what to clarify, what to prove, what to publish, what to route, and what to change each week.
Bottom line
A founder-led GTM dashboard is not a prettier report. It is the weekly decision layer for making a technical company more market-readable.